1. Method
The dataset is every accepted packet that passed frame validation at the ingest edge during 2025. A packet is "accepted" when the primary header validated, the CRC matched where the frame carried one, and the packet was not a duplicate of one already seen within the deduplication window. Rejected frames are counted separately and appear in the gap section; mixing them with accepted traffic would understate the real signal.
Three quantities are derived per spacecraft per day, then aggregated:
- Ingest latency — the interval between the edge acknowledgement and the moment the sample became queryable through the API.
- Gap ratio — the fraction of expected telemetry intervals with no accepted packet, computed per virtual channel against the declared downlink period.
- Downlink yield — accepted packets divided by packets the spacecraft was expected to emit during the pass.
Expected downlink period comes from the spacecraft registry, not from observed traffic. If a spacecraft declares a one-second housekeeping period and the data shows a one-second cadence, the observed cadence confirms the declaration; where it does not, the registry is wrong and the registry is what we measure against. This matters, because a gap ratio computed against an observed period cannot detect a spacecraft that stopped transmitting entirely.
Ingest latency
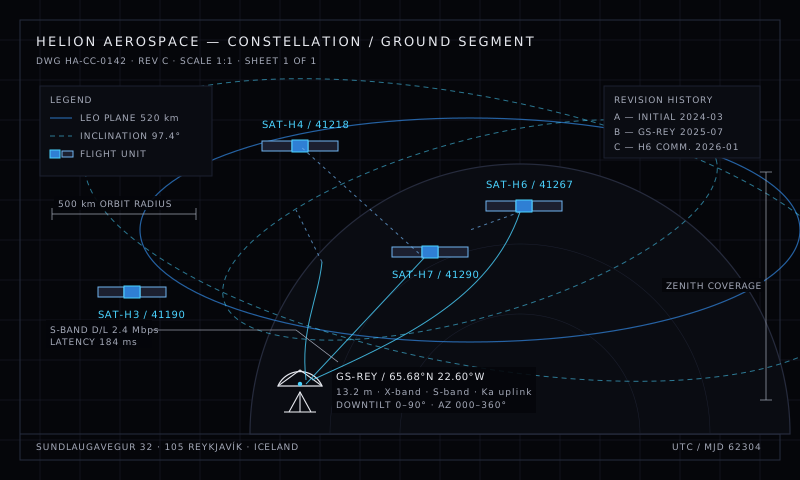
The headline number is 190 milliseconds at the median. The distribution is not symmetric and the mean is 243 milliseconds, pulled up by a tail that comes from object storage writes competing with bulk export jobs.
The latency is modelled as the sum of four components: edge processing, queue wait, write commit and read-path publication.
L_total = L_edge + L_queue + L_write + L_publish
At the median, edge processing accounts for 41 ms and queue wait for 78 ms. The remaining 71 ms is split roughly evenly between the write commit and the publication of the sample into the query index. The queue wait is the largest single term because it is the one that responds to load: when a station is streaming at the committed rate, samples wait behind each other in a durable queue before the write is attempted.
The ninety-fifth percentile is 1.4 seconds. The ninety-ninth is 3.8 seconds. We publish the ninety-ninth because an operator running a control loop on downlink scheduling needs to know about the tail, not because the tail is typical. In 2025 we changed three things to shorten it: export jobs were moved to a separate write path so that a bulk Parquet export no longer competed with ingest commits; the publication step was changed from a synchronous index update to a batched one with a 50 ms window; and edge processing was rebalanced across workers after we found that the partition key was concentrating packets from a single station onto a single worker.
2. Gaps
Across the network, the median gap ratio was 0.42%. Distribution matters more than the median here, because the failure modes are completely different. A spacecraft with a 0.1% gap ratio has an antenna problem or a duty cycle that is not being met. A spacecraft with a 5% gap ratio usually has a station that is acquiring late.
Broken down by cause, as recorded by the ingest edge:
g = g_station + g_uplink + g_spacecraft + g_scheduler
| Component | Share of all gaps | Typical cause |
|---|
| Station acquisition | 41% | Acquisition later than scheduled, first packet outside the window |
| Spacecraft duty cycle | 29% | Recorder playback, downlink scheduled to a later pass |
| Uplink contention | 18% | Two spacecraft contending for the same station slot |
| Loss in transit | 8% | Carrier drop with no retransmission from the station |
| Decoder rejection | 4% | CRC mismatch or an unmapped APID |
That first row is the interesting one. Nearly half of all gaps are not gaps in the data but gaps in the schedule: the spacecraft was transmitting and the station was not listening yet. The fix is not more bandwidth. It is scheduling the acquisition window with the station's own clock offset applied rather than with the nominal one.
Over 2025 we changed the default scheduling behaviour to subtract the measured station clock offset from every window, and to treat the first fifteen seconds of an acquisition as a reserved region that may not be scheduled for another spacecraft. That change alone reduced the station acquisition share of gaps from 49% to 41% in the following two quarters, and it cost nothing because the reserved region was previously unusable in practice.
3. Battery margins
Of the 412 spacecraft in the dataset, 268 declared a battery bus voltage parameter with a usable range. We grouped them by orbital regime because the eclipse fraction and the thermal environment dominate the outcome, and mixing regimes produces a mean that describes no spacecraft in particular.
For each spacecraft we computed the depth of discharge during eclipse:
DoD = (V_charge - V_eclipse_min) / (V_charge - V_floor)
where V_charge is the plateau voltage at the start of the charge phase, V_eclipse_min is the minimum bus voltage observed during eclipse, and V_floor is the spacecraft's declared minimum safe bus voltage. The results by regime:
| Regime | Spacecraft | Median DoD | 95th percentile DoD | Share above 0.85 |
|---|
| SSO, 500–600 km | 146 | 0.58 | 0.81 | 4% |
| SSO, 700–800 km | 71 | 0.51 | 0.73 | 2% |
| Equatorial LEO | 33 | 0.62 | 0.86 | 9% |
| Mid-inclination LEO | 18 | 0.55 | 0.79 | 0% |
The equatorial group is the outlier and the reason it is worth a table. Higher beta angle means longer illumination and a shorter eclipse, which sounds safer, but in practice these spacecraft were flown with a higher duty cycle because the payload could afford it. The result is a deeper discharge per eclipse, on a smaller margin. Five of the nine equatorial spacecraft above 0.85 did so during a beta-angle season rather than a hardware fault, and all five recovered when the duty cycle was reduced for the summer.
The second observation concerns recharge rate. Eleven spacecraft in the dataset showed a charge plateau voltage more than 0.4 V below the nominal value for periods longer than four hours, and in every case the corresponding battery current was also lower than the declared charge rate. The pattern is a charge current limit that was configured for a different battery configuration, not a battery fault. We now surface a derived charge_current_deviation metric in the platform so this class of misconfiguration is visible without an operator having to correlate two parameters by hand.
4. Downlink budget
Yield is the fraction of expected packets that arrived. The network median was 94.1%, with a wide spread:
| Spacecraft class | Median yield | 5th percentile | Passes per day | Median usable minutes |
|---|
| Dedicated slot, one spacecraft | 97.8% | 91.2% | 14.2 | 9.4 |
| Shared slot, one spacecraft | 92.6% | 74.8% | 13.8 | 7.1 |
| Shared slot, four spacecraft | 86.3% | 61.5% | 13.4 | 4.9 |
| Recorder playback | 99.1% | 95.5% | 2.6 | 38.7 |
Contention is the whole story in the middle rows. A dedicated slot delivers 97.8% because nothing competes with it. Four spacecraft sharing a slot each receive roughly 86%, and the fifth percentile — the bad day — is 61.5%, which means one spacecraft in four loses more than a third of its telemetry in a pass. Recorder playback, by contrast, has the highest yield and by far the longest usable time, because the data was recorded on board and comes down whenever there is room.
This is why we treat a dedicated station slot as a product rather than as a feature of the platform. The median difference between a dedicated slot and a shared one is 11.4 percentage points of yield, and the tail difference is far larger than the median suggests.
5. Contact window utilisation
For operators planning their own schedules, the useful question is how much of the geometric visibility arc is actually usable. We define the usable fraction as:
u = (T_los - T_aos - T_settle) / (T_los - T_aos)
where T_settle is the time between acquisition of signal and the moment the spacecraft's downlink is at its full rate, typically 8 to 30 seconds depending on the spacecraft's onboard state machine.
Across the network the median usable fraction was 0.78. The distribution had a clear structure: spacecraft in a low-inclination orbit with an equatorial station saw usable fractions above 0.90, while spacecraft needing a high minimum elevation saw values below 0.65, because the settle period was consuming a larger share of an already short arc.
The practical conclusion is that for a spacecraft with a ten-minute geometric window and a twenty-second settle time, the effective window is 8 minutes and 40 seconds, not ten. Scheduling to the geometric window produces a schedule that is optimistic by 5.5% on average, which is enough to lose the last packet of every pass for a spacecraft whose recorders are tight.
6. What we changed
Three changes came out of the 2025 data and shipped in the first quarter of 2026.
- Measured clock offsets are applied to scheduling. Station acquisition gaps fell from 49% to 41% of all gaps. This was a scheduling fix, not a hardware one.
- Export jobs run on a separate write path. The ninety-ninth percentile ingest latency fell from 6.1 s to 3.8 s across the period where bulk exports were active.
- Charge current deviation is a derived metric. Eleven misconfigured charge limits were found in the dataset; operators on the platform now see the same derivation automatically.
Two things we did not change, because the data did not support it. First, we did not make the median ingest latency smaller. At 190 ms it is already well below anything an operator's ground software needs, and spending effort there would have been optimisation for its own sake. Second, we did not change the gap ledger format. Several operators parse it, and a format change would have broken working scripts for no operational benefit.
7. Caveats
Three limitations apply to everything above. The dataset is biased toward spacecraft with a declared housekeeping period, since the gap ratio requires one; 144 spacecraft were excluded from the gap analysis for that reason. The battery analysis excludes 144 spacecraft as well, for the separate reason that no battery voltage parameter was declared. And the sample is drawn from operators who chose to run their ground segment through a hosted platform, which is a population with its own characteristics — most obviously, a lower rate of custom hardware than the full population of small satellite operators.
We will publish the 2027 edition in January 2027 with the same method, so the series is comparable. The method changes we make in between will be noted here.
Questions about the methodology, or an operator who would like their spacecraft included in next year's edition, can write to support@helionhq.link.